Swarm of IP pingers coordinated with MQTT and reported in Kibana
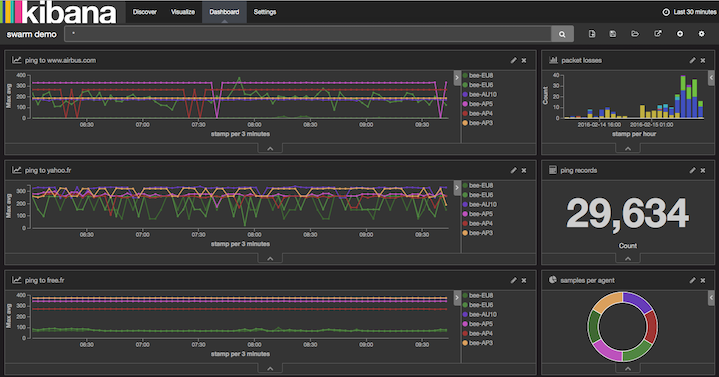
The objective of this use case is to deploy a swarm of network pingers at multiple data centres. MQTT is used across the swarm to coordinate the pingers and to consolidate data. The back-end IPv6 infrastructure provided by Dimension Data is used to streamline MQTT traffic across agents and broker, in a secured backbone. Ping results are recorded in a centralised Elasticsearch server, and shown in a Kibana interactive dashboard.
The network and security services coming with cloud services from Dimension Data are used to control access and to secure remote access to various building blocks of the architecture.
Project credits: Swarming project from Mathieu Lecarme
Requirements for this use case
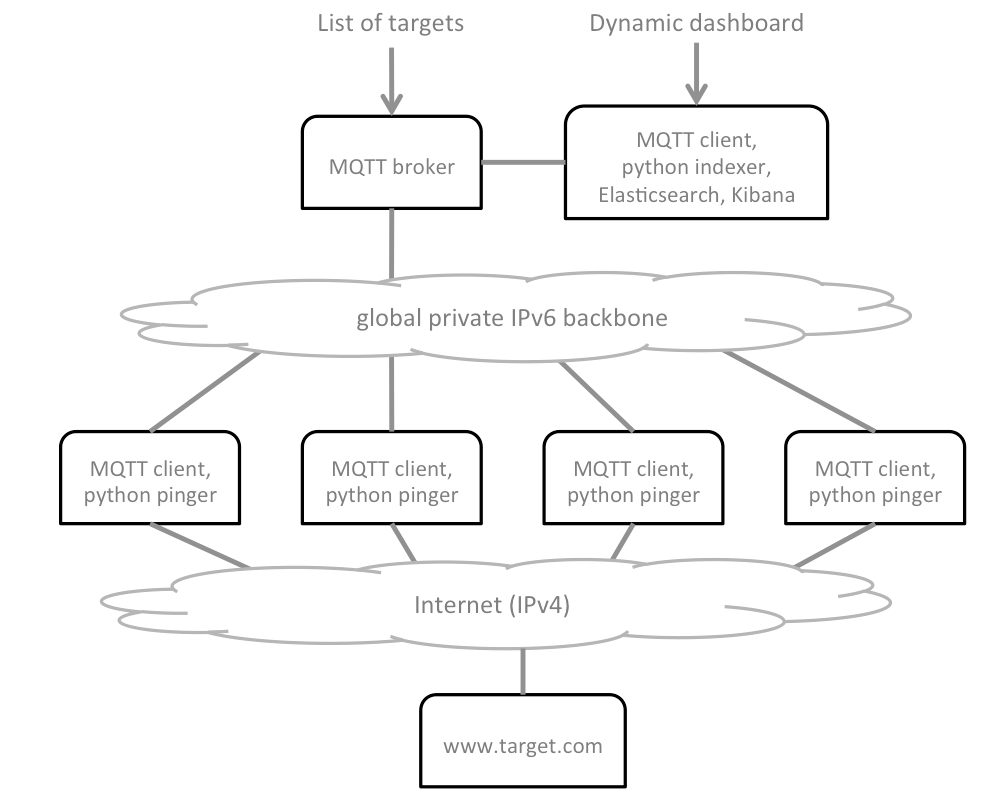
The diagram below provides some essential understanding of the architecture to be deployed:
There are a number of actions involved in the overall deployment, and plumbery will assist to orchestrate all of them, except the custom configuration of the Kibana dashboard:
- Deploy a MQTT broker in the focus data centre – the queen
- Deploy an Elasticsearch & Kibana server in the same data centre – the dashboard
- Deploy pinger nodes in multiple data centres world-wide – the bees
- Create a Network Domain at each location
- Create an Ethernet network at each location
- Allow IPv6 traffic between MQTT clients (the bees) and the broker (the queen)
- Add nodes to the automated monitoring dashboard
- Assign public IPv4 addresses to each node
- Add address translation to ensure SSH access to the nodes from the internet
- Add firewall rules to accept TCP traffic on port 22 (ssh)
- Add firewall rule to allow web traffic to the dashboard server
- Update etc/hosts to bind IPv6 addresses to host names
- Manage keys to suppress passwords in SSH connections
- Install MQTT server at the queen node
- Install MQTT client software at bees and at the dashboard
- Install pingers in python at bee nodes
- Install indexer programs in python at the dashboard node
- Install Elasticsearch and Kibana at the dashboard node
- Feed the list of addresses to ping at the queen node
- Configure Kibana to deliver the visual reporting dashboard
Fittings plan
The plan below demonstrates multiple interesting tips and tricks:
- Provide SSH access to all nodes via public IPv4, NAT, and firewall settings
- Management of SSH keys to enable secured communications without passwords
- Allow private IPv6 communications between remote data centres and the focus data centre
- Automatic registration of all nodes to the monitoring services provided by Dimension Data
- Update of etc/hosts with IPv6
- Install swarming software in python directly from GitHub repository
- Turn a python command to a service that can be started and stopped on-demand
- Remove Apache, and install Nginx instead
- Install an interactive dashboard with Elasticseach and Kibana
- Configure Nginx as efficient and secured proxy to Kibana
- Orchestrate generation and configuration of web password to the dashboard
- Automate the installation of Oracle 8 JDK
- User documentation of the infrastructure is put directly in the fittings plan
Download this fittings plan if you want to hack it for yourself. This is part of the demonstration
directory of the plumbery project at GitHub. Alternatively, you can copy the
text below and put it in a text file named fittings.yaml.
1 2 3 4 5 6 7 8 9 10 11 12 13 14 15 16 17 18 19 20 21 22 23 24 25 26 27 28 29 30 31 32 33 34 35 36 37 38 39 40 41 42 43 44 45 46 47 48 49 50 51 52 53 54 55 56 57 58 59 60 61 62 63 64 65 66 67 68 69 70 71 72 73 74 75 76 77 78 79 80 81 82 83 84 85 86 87 88 89 90 91 92 93 94 95 96 97 98 99 100 101 102 103 104 105 106 107 108 109 110 111 112 113 114 115 116 117 118 119 120 121 122 123 124 125 126 127 128 129 130 131 132 133 134 135 136 137 138 139 140 141 142 143 144 145 146 147 148 149 150 151 152 153 154 155 156 157 158 159 160 161 162 163 164 165 166 167 168 169 170 171 172 173 174 175 176 177 178 179 180 181 182 183 184 185 186 187 188 189 190 191 192 193 194 195 196 197 198 199 200 201 202 203 204 205 206 207 208 209 210 211 212 213 214 215 216 217 218 219 220 221 222 223 224 225 226 227 228 229 230 231 232 233 234 235 236 237 238 239 240 241 242 243 244 245 246 247 248 249 250 251 252 253 254 255 256 257 258 259 260 261 262 263 264 265 266 267 268 269 270 271 272 273 274 275 276 277 278 279 280 281 282 283 284 285 286 287 288 289 290 291 292 293 294 295 296 297 298 299 300 301 302 303 304 305 306 307 308 309 310 311 312 313 314 315 316 317 318 319 320 321 322 323 324 325 326 327 328 329 330 331 332 333 334 335 336 337 338 339 340 341 342 343 344 345 346 347 348 349 350 351 352 353 354 355 356 357 358 359 360 361 362 363 364 365 366 367 368 369 370 371 372 373 374 375 376 377 378 379 380 381 382 383 384 385 386 387 388 389 390 391 392 393 394 395 396 397 398 399 400 401 402 403 404 405 406 407 408 409 410 411 412 413 414 415 416 417 418 419 420 421 422 423 424 425 426 427 428 429 430 431 432 433 434 435 436 437 438 439 440 441 442 443 444 445 446 447 448 449 450 451 452 453 454 455 456 457 458 459 460 461 462 463 464 465 466 467 468 469 470 471 472 473 474 475 476 477 478 479 480 481 482 483 484 485 486 487 488 489 490 491 492 | ---
information:
- "These fittings plan are aiming to deploy multiple pingers connected"
- "to a MQTT server and to a Kibana dashboard"
links:
documentation: https://plumbery.readthedocs.org/en/latest/tutorial.mqtt.pinger.swarm.html
credit: https://github.com/athoune/swarming
defaults:
# deploy a limited number of bugs by default
#
blueprints: queen drones
# the same network domain is used at various facilities
#
domain:
name: PingerSwarmFox
description: "Demonstration of MQTT with multiple pingers"
ipv4: auto
# the same ethernet configuration is used at various facilities
#
ethernet:
name: SwarmNetwork
subnet: 10.0.0.0
# default settings for a remote probe
#
bee:
description: "#swarm #bee #mqtt #ubuntu"
information:
- "a pinger controlled via MQTT"
- "troubleshoot with:"
- "$ ssh ubuntu@{{ node.public }}"
appliance: 'Ubuntu 14'
cpu: 2
memory: 3
glue:
- internet 22
monitoring: essentials
cloud-config:
hostname: "{{ node.name }}"
packages:
- ntp
- mosquitto-clients
- git
- python-pip
write_files:
- path: /root/hosts.awk
content: |
#!/usr/bin/awk -f
/^{{ node.private }}/ {next}
/^{{ node.ipv6 }}/ {next}
/^{{ dd-au::AU10::queen.ipv6 }}/ {next}
{print}
END {
print "{{ node.private }} {{ node.name }}"
print "{{ node.ipv6 }} {{ node.name }}"
print "{{ dd-au::AU10::queen.ipv6 }} queen"
}
- path: /etc/init/swarm-pinger.conf
content: |
description "Swarm pinger"
start on runlevel [2345]
stop on runlevel [!2345]
start on startup
exec /home/ubuntu/swarming/swarming.py queen
runcmd:
- echo "===== Handling ubuntu identity"
- cp -n /etc/ssh/ssh_host_rsa_key /home/ubuntu/.ssh/id_rsa
- cp -n /etc/ssh/ssh_host_rsa_key.pub /home/ubuntu/.ssh/id_rsa.pub
- chown ubuntu:ubuntu /home/ubuntu/.ssh/*
- sed -i "/StrictHostKeyChecking/s/^.*$/ StrictHostKeyChecking no/" /etc/ssh/ssh_config
- echo "===== Updating /etc/hosts"
- cp -n /etc/hosts /etc/hosts.original
- awk -f /root/hosts.awk /etc/hosts >/etc/hosts.new && mv /etc/hosts.new /etc/hosts
- echo "===== Installing swarming software"
- cd /home/ubuntu
- git clone https://github.com/bernard357/swarming.git
- cd swarming
- pip install -r requirements.txt
- echo "===== Running swarming software"
- service swarm-pinger start
# default settings for all nodes created by plumbery
#
cloud-config:
# plumbery generates a random key pair
#
ssh_keys:
rsa_private: |
{{ key.rsa_private }}
rsa_public: "{{ key.rsa_public }}"
users:
- default
- name: ubuntu
sudo: 'ALL=(ALL) NOPASSWD:ALL'
ssh-authorized-keys:
- "{{ key.rsa_public }}"
- "{{ local.rsa_public }}"
- name: root
ssh-authorized-keys:
- "{{ key.rsa_public }}"
- "{{ local.rsa_public }}"
disable_root: false
ssh_pwauth: false
---
locationId: AU10
regionId: dd-au
blueprints:
- queen:
ethernet:
accept:
- dd-ap::AP3::SwarmNetwork
- dd-ap::AP4::SwarmNetwork
- dd-ap::AP5::SwarmNetwork
- dd-au::AU11::SwarmNetwork
- dd-eu::EU6::SwarmNetwork
- dd-eu::EU8::SwarmNetwork
- dd-na::NA9::SwarmNetwork
- dd-na::NA12::SwarmNetwork
nodes:
- queen: # the MQTT server
description: "#swarm #queen #mqtt #ubuntu"
information:
- "a MQTT broker to control a swarm of pingers"
- "$ ssh ubuntu@{{ node.public }}"
- "change target addresses with something like the following:"
- '$ mosquitto_pub -t watch -m "free.fr yahoo.fr yahoo.cn" -q 1'
- "check the flow of pings with:"
- '$ mosquitto_sub -t "ping/+" -v'
appliance: 'Ubuntu 14'
cpu: 2
memory: 3
glue:
- internet 22
monitoring: essentials
cloud-config:
hostname: "{{ node.name }}"
apt_sources:
- source: "ppa:mosquitto-dev/mosquitto-ppa"
packages:
- ntp
- mosquitto
- mosquitto-clients
- git
- python-pip
write_files:
- path: /root/hosts.awk
content: |
#!/usr/bin/awk -f
/^{{ node.private }}/ {next}
/^{{ queen.ipv6 }}/ {next}
/^{{ dashboard.ipv6 }}/ {next}
/^{{ dd-na::NA9::bee-NA9.ipv6 }}/ {next}
{print}
END {
print "{{ node.private }} {{ node.name }}"
print "{{ queen.ipv6 }} queen"
print "{{ dashboard.ipv6 }} dashboard"
print "{{ dd-na::NA9::bee-NA9.ipv6 }} bee-NA9"
}
runcmd:
- echo "===== Handling ubuntu identity"
- cp -n /etc/ssh/ssh_host_rsa_key /home/ubuntu/.ssh/id_rsa
- cp -n /etc/ssh/ssh_host_rsa_key.pub /home/ubuntu/.ssh/id_rsa.pub
- chown ubuntu:ubuntu /home/ubuntu/.ssh/*
- sed -i "/StrictHostKeyChecking/s/^.*$/ StrictHostKeyChecking no/" /etc/ssh/ssh_config
- echo "===== Updating /etc/hosts"
- cp -n /etc/hosts /etc/hosts.original
- awk -f /root/hosts.awk /etc/hosts >/etc/hosts.new && mv /etc/hosts.new /etc/hosts
- echo "===== Installing swarming software"
- cd /home/ubuntu
- git clone https://github.com/bernard357/swarming.git
- cd swarming
- pip install -r requirements.txt
- dashboard: # the Kibana and Elasticsearch engine
description: "#swarm #dashboard #kibana #ubuntu"
information:
- "a web dashboard to visualize pings:"
- "http://{{ dashboard.public }}"
- "authenticate with 'dashboard' and '{{ dashboard.secret }}'"
- "troubleshoot with:"
- "$ ssh ubuntu@{{ node.public }}"
- "check the feeding of elasticsearch with:"
- "$ curl 'http://localhost:9200/_cat/indices?v'"
appliance: 'Ubuntu 14'
cpu: 2
memory: 3
glue:
- internet 22 80
monitoring: essentials
cloud-config:
hostname: "{{ node.name }}"
bootcmd:
# remove apache
- apt-get remove apache2 -y
- apt-get autoremove -y
# automate acceptance of oracle licence
- echo "oracle-java8-installer shared/accepted-oracle-license-v1-1 select true" | sudo debconf-set-selections
- echo "oracle-java8-installer shared/accepted-oracle-license-v1-1 seen true" | sudo debconf-set-selections
apt_sources:
- source: "ppa:mosquitto-dev/mosquitto-ppa"
- source: "ppa:webupd8team/java"
packages:
- ntp
- mosquitto-clients
- git
- oracle-java8-installer
- python-pip
- nginx
- apache2-utils
write_files:
- path: /root/hosts.awk
content: |
#!/usr/bin/awk -f
/^{{ node.private }}/ {next}
/^{{ queen.ipv6 }}/ {next}
/^{{ dashboard.ipv6 }}/ {next}
/^{{ dd-na::NA9::bee-NA9.ipv6 }}/ {next}
{print}
END {
print "{{ node.private }} {{ node.name }}"
print "{{ queen.ipv6 }} queen"
print "{{ dashboard.ipv6 }} dashboard"
print "{{ dd-na::NA9::bee-NA9.ipv6 }} bee-NA9"
}
- path: /etc/nginx/sites-available/default.swarm
content: |
server {
listen 80;
server_name {{ node.public }};
auth_basic "Restricted Access";
auth_basic_user_file /etc/nginx/htpasswd.users;
location / {
proxy_pass http://localhost:5601;
proxy_http_version 1.1;
proxy_set_header Upgrade $http_upgrade;
proxy_set_header Connection 'upgrade';
proxy_set_header Host $host;
proxy_cache_bypass $http_upgrade;
}
}
- path: /etc/init/swarm-indexer.conf
content: |
description "Swarm indexer"
start on runlevel [2345]
stop on runlevel [!2345]
start on startup
exec /home/ubuntu/swarming/indexer.py queen
runcmd:
- echo "===== Handling ubuntu identity"
- cp -n /etc/ssh/ssh_host_rsa_key /home/ubuntu/.ssh/id_rsa
- cp -n /etc/ssh/ssh_host_rsa_key.pub /home/ubuntu/.ssh/id_rsa.pub
- chown ubuntu:ubuntu /home/ubuntu/.ssh/*
- sed -i "/StrictHostKeyChecking/s/^.*$/ StrictHostKeyChecking no/" /etc/ssh/ssh_config
- echo "===== Updating /etc/hosts"
- cp -n /etc/hosts /etc/hosts.original
- awk -f /root/hosts.awk /etc/hosts >/etc/hosts.new && mv /etc/hosts.new /etc/hosts
- echo "===== Installing Elasticsearch, Kibana"
- cd /root
- wget -qO - https://packages.elastic.co/GPG-KEY-elasticsearch | sudo apt-key add -
- echo "deb http://packages.elastic.co/elasticsearch/2.x/debian stable main" | sudo tee -a /etc/apt/sources.list.d/elasticsearch-2.x.list
- echo "deb http://packages.elastic.co/kibana/4.4/debian stable main" | sudo tee -a /etc/apt/sources.list.d/kibana-4.4.x.list
- apt-get update
- apt-get install elasticsearch kibana
- update-rc.d elasticsearch defaults 95 10
- service elasticsearch start
- update-rc.d kibana defaults 96 9
- service kibana start
- echo "===== Securing web access"
- cp -n /etc/nginx/sites-available/default /etc/nginx/sites-available/default.original
- cp /etc/nginx/sites-available/default.swarm /etc/nginx/sites-available/default
- htpasswd -cb /etc/nginx/htpasswd.users dashboard {{ dashboard.secret }}
- service nginx restart
- echo "===== Installing swarming software"
- cd /home/ubuntu
- git clone https://github.com/bernard357/swarming.git
- cd swarming
- pip install -r requirements.txt
- echo "===== Running swarming software"
- service swarm-indexer restart
- drones:
nodes:
- bee-AU10:
default: bee
---
locationId: AP3
regionId: dd-ap
blueprints:
- drones:
ethernet:
accept:
- dd-au::AU10::SwarmNetwork
nodes:
- bee-AP3:
default: bee
---
locationId: AP4
regionId: dd-ap
blueprints:
- bees:
ethernet:
accept:
- dd-au::AU10::SwarmNetwork
nodes:
- bee-AP4:
default: bee
---
locationId: AP5
regionId: dd-ap
blueprints:
- bees:
ethernet:
accept:
- dd-au::AU10::SwarmNetwork
nodes:
- bee-AP5:
default: bee
---
locationId: AU11
regionId: dd-au
blueprints:
- drones:
ethernet:
accept:
- dd-au::AU10::SwarmNetwork
nodes:
- bee-AU11:
default: bee
---
locationId: EU6
regionId: dd-eu
blueprints:
- drones:
ethernet:
accept:
- dd-au::AU10::SwarmNetwork
nodes:
- bee-EU6:
default: bee
---
locationId: EU8
regionId: dd-eu
blueprints:
- bees:
ethernet:
accept:
- dd-au::AU10::SwarmNetwork
nodes:
- bee-EU8:
default: bee
---
locationId: NA9
regionId: dd-na
blueprints:
- bees:
ethernet:
accept:
- dd-au::AU10::SwarmNetwork
nodes:
- bee-NA9:
default: bee
---
locationId: NA12
regionId: dd-na
blueprints:
- drones:
ethernet:
accept:
- dd-au::AU10::SwarmNetwork
nodes:
- bee-NA12:
default: bee
|
Deployment commands
For this tutorial, plumbery has to connect separately to multiple data centres and to apply several changes in multiple waves.
$ python -m plumbery fittings.yaml deploy
This command will build fittings as per the provided plan, and start servers as well. Look at messages displayed by plumbery while it is working, so you can monitor what’s happening.
Follow-up commands
At the end of the deployment, plumbery will display on screen some instructions to help you move forward. You can ask plumbery to display this information at any time with the following command:
$ python -m plumbery fittings.yaml information
What’s coming next? You may want to connect to the queen node in ssh and check the stream of records coming from pingers to the broker via MQTT.
$ ssh ubuntu@<IPv4 of queen node>
Subscribe to the MQTT stream from the command line like this:
$ mosquitto_sub -t "ping/+" -v
After some seconds you will see records popping up from various parts of the world.
Now, let’s move to the dashboard server to check the feeding of the elasticsearch server.
$ ssh ubuntu@<IPv4 of dashboard node>
From there you can validate the number of records in the index named ‘swarm’ with the following command:
$ curl 'http://localhost:9200/_cat/indices?v'
Repeat the command multiple times and check the increment of documents indexed by Elasticsearch.
If everything is looking fine at this stage, then you are allowed to move to the configuration of the Kibana interactive dashboard. In a browser window, type the public IPv4 address of the dashboard server. When asked for it, provide the name and the password that were mentioned by plumbery during the deployment of the fittings plan.
From there you can select the ‘swarm’ index and configure the dashboard as per your very specific needs.
Change the list of addresses to ping
Ask all pingers to change the list of targets by acting at the MQTT broker. For this, go to the queen node and type a command like the following:
$ mosquitto_pub -t watch -m "free.fr yahoo.fr yahoo.cn" -q 1
Destruction commands
At the end of the demonstration, you may want to reduce costs with the following:
$ python -m plumbery fittings.yaml dispose